在 Matplotlib 中使用图像
原文:https://www.studytonight.com/matplotlib/working-with-images-in-matplotlib
在本教程中,我们将介绍如何在 Matplotlib 库中处理图像。
在 Matploltlib 库中,image模块用于在图和图形中添加图像。
matplotlib 只支持 PNG 图像。
图像模块
imread(有两种有用且重要的方法,分别用于读取图像 ) 和imshow(用于显示图像)。
现在我们将介绍一些展示如何使用图像的示例:
例 1:
在代码片段中,我们将使用imread()读取图像,然后使用imshow()显示图像:
import matplotlib.pyplot as plt
import matplotlib.image as img

testImage = img.imread('C:\\Users\\StudyTonight\\Desktop\\logoo.png')

plt.imshow(testImage)
以下是输出:

例 2:
在下面给出的代码示例中,我们使用imread()读取图像,然后以数组的形式表示它:
import matplotlib.pyplot as plt
import matplotlib.image as img

testImage = img.imread('C:\\Users\\StudyTonight\\Desktop\\logoo.png')

print(testImage)
[[[1。1.1.1.】 【1。1.1.1.】 【1。1.1.1.】 ... 【1。1.1.1.】 【1。1.1.1.】 【1。1.1.1.】】
【【1】。1.1.1.】 【1。1.1.1.】 【1。1.1.1.】 ... 【1。1.1.1.】 【1。1.1.1.】 【1。1.1.1.】】
【【1。1.1.1.】 【1。1.1.1.】 【1。1.1.1.】 ... 【1。1.1.1.】 【1。1.1.1.】 【1。1.1.1.】】
...
【【1。1.1.1.】 【1。1.1.1.】 【1。1.1.1.】 ... 【1。1.1.1.】 【1。1.1.1.】 【1。1.1.1.】】
【【1。1.1.1.】 【1。1.1.1.】 【1。1.1.1.】 ... 【1。1.1.1.】 【1。1.1.1.】 【1。1.1.1.】
【【1】。1.1.1.】 【1。1.1.1.】 【1。1.1.1.】 ... 【1。1.1.1.】 【1。1.1.1.】 【1。1.1.1.]]]
例 3:
在下面给出的示例中,我们将修改图像的所有参数:
import matplotlib.pyplot as plt
import matplotlib.image as img

testImage = img.imread('C:\\Users\\StudyTonight\\Desktop\\logoo.png')

print(testImage.shape)

modifiedImage = testImage[50:200, 100:200, 1]

plt.imshow(modifiedImage)
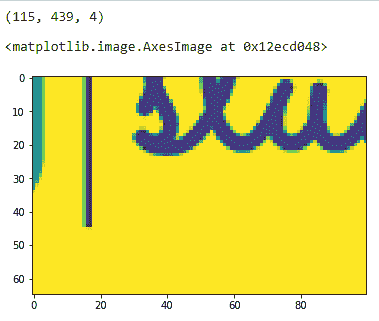
在上面的代码中,图像的高度是 150 像素(从第 50 个像素开始显示),宽度是 100 像素(从第 100 个像素开始显示),模式值是 1。
以下是上述代码的输出:
结论:
至此,我们的 Matplotlib 教程到此结束。我们将继续向本教程添加更多的教程页面和指南,以及一些 Matplotlib 图和图形的应用。